Check out our free Chrome Extension.

The State of Ecommerce in 2026

Updated Jan 2 2026

Ecommerce platform usage has exploded over recent years as the world's economy transitions to online. Our mission is to observe and inform on ecommerce usage trends so that app developers and marketers can help merchants succeed. To that end, we are tracking 13,058,215 live stores running on 100 different ecommerce platforms.

Platform Distribution

Here is a summary of the current state of the ecommerce platforms wars:

  • By merchant count, WooCommerce and Shopify dominate. Shopify is growing slightly faster, appears to have greater mindshare and has larger merchants on average.
  • Magento and PrestaShop are quite close, in terms of merchant count, but the average Magento merchant is much larger.
  • Square Online is the ecommerce platform with the highest percentage growth, though it mostly powers micro-merchants.
  • Salesforce Commerce Cloud powers relatively few stores but their stores are some of the biggest merchants around (Patagonia, PUMA, etc.)

Platform
Active Stores
4,435,429
2,846,464
1,668,185
Wix
522,800
372,572
287,136
222,636
191,948
176,303
170,348
169,493
120,028
116,364
110,027
67,759
63,000
51,852
48,740
46,015
45,876
36,417
35,259
33,876
32,697
32,692
30,851
26,750
24,576
23,802
23,137
20,924
19,379
19,134
17,755
17,533
16,660
15,555
15,463
15,324
15,258
14,369
13,818
13,668
12,870
11,746
10,887
10,880
10,755
10,598
10,574
10,325
10,000
9,985
9,801
9,356
9,086
Zid
8,977
8,523
8,458
8,396
8,390
8,079
7,704
7,377
7,017
7,007
6,974
6,909
6,868
6,743
6,725
6,347
6,301
6,212
6,050
5,902
5,853
5,382
5,261
5,231
4,986
4,982
4,954
OMG
4,670
4,606
4,434
4,429
4,227
3,984
3,929

Quarterly Growth

Quarter-over-quarter growth across all platforms has been quite impressive over the last few years. With the world's economy continuing to move online, there is little reason to expect it to change.

Quarter
Active Stores
2017 Q1
60,585
2017 Q2
99,351
2017 Q3
51,079
2017 Q4
54,274
2018 Q1
90,398
2018 Q2
501,027
2018 Q3
162,465
2018 Q4
138,080
2019 Q1
293,165
2019 Q2
143,728
2019 Q3
176,599
2019 Q4
158,021
2020 Q1
190,000
2020 Q2
220,732
2020 Q3
200,423
2020 Q4
291,613
2021 Q1
387,528
2021 Q2
392,498
2021 Q3
378,398
2021 Q4
217,546
2022 Q1
221,966
2022 Q2
168,809
2022 Q3
420,383
2022 Q4
203,941
2023 Q1
225,035
2023 Q2
332,358
2023 Q3
502,038
2023 Q4
479,160
2024 Q1
470,309
2024 Q2
515,520
2024 Q3
468,219
2024 Q4
556,275
2025 Q1
646,804
2025 Q2
818,155
2025 Q3
904,604
2025 Q4
1,212,361
2026 Q1 (to date)
90,525
Active Store Count by Quarter

It's hard to know exactly when a store was first created but we use a heuristic that includes historical DNS data which provides a reasonable approximation.

Top Stores

Here are the top 5 ecommerce stores, across the platforms we track, ordered by worldwide store rank.

Name
Domain
Rank
Platform
Created
Amazon
1
Custom Cart
2016/12/30
Apple
2
Custom Cart
2025/03/07
Walmart
3
Custom Cart
2016/12/30
The Depot
4
Custom Cart
2016/12/30
Microsoft
5
Custom Cart
2016/12/30

New Stores

Here are the 5 highest-ranked stores added most recently.

Name
Domain
Rank
Platform
Created
Club Dada
41,094
WooCommerce
2026/01/02
Mountain Entertainment
55,579
Magento
2026/01/02
Joshua Giles Global
77,115
Wix
2026/01/02
Arthurs
92,442
Shopify
2026/01/02
mensreproductivehealth.com
123,242
WooCommerce
2026/01/02

Category Breakdown

Here are the top 20 industry verticals for stores on the platforms we track.

Category
Stores
Apparel
1,881,199
Home & Garden
1,342,863
Food & Drink
969,121
Beauty & Fitness
885,155
Business & Industrial
690,897
People & Society
658,667
Arts & Entertainment
640,523
Health
596,361
Sports
435,849
Computers
390,602
Jobs & Education
357,955
Autos & Vehicles
349,143
Toys & Hobbies
250,055
Travel
238,409
Pets & Animals
207,577
Gifts & Special Events
204,310
Consumer Electronics
203,745
Internet
195,296
Books & Literature
171,750

Country Breakdown

Across the platforms we track, the largest install base is within the United States. But the platforms have a solid presence within the United Kingdom, Canada and Australia as well.

Country
Stores
None
2,978,792
United States
2,963,750
United Kingdom
605,296
Germany
430,098
Brazil
392,365
India
376,797
Canada
325,693
Australia
313,094
France
296,722
Netherlands
262,565

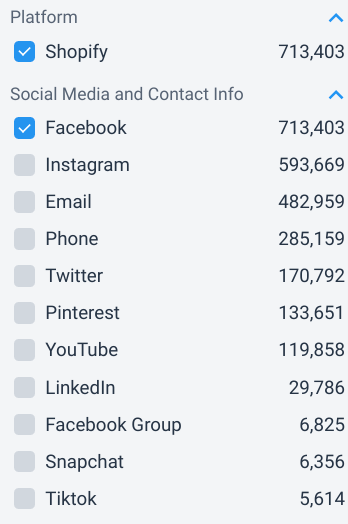
Social Media and Contact Info

Facebook, Twitter, Instagram and Pinterest have significant presence across stores, with Facebook and Instagram especially showing quite strongly.

As expected, email remains an extremely popular communication channel.

Type
Stores
Email
6,589,353
Phone
6,220,488
Instagram
5,302,582
Facebook
4,060,142
YouTube
1,481,473
Twitter
1,090,205
LinkedIn
751,117
Tiktok
746,021
WhatsApp
615,764
Pinterest
559,380

Third-Party Technologies

Many merchants run third-party technologies on their store in addition to apps from their ecommerce platform's App Store. We're tracking 929 different technologies that have 66,037,598 collective installs.

Here are the top 10 third-party technologies, ordered by number of installs, across all stores.

Technology
Stores
5,060,591
4,538,444
4,508,122
4,503,975
4,333,955
4,166,866
3,030,981
2,804,673
2,658,754
2,381,297

Shipping Carriers

Here are the top 10 shipping carriers, ordered by frequency of use, across all stores.

Shipping Carrier
Stores
USPS
513,721
UPS
452,942
Fedex
271,927
Correios
121,367
Royal Mail
102,367
Australia Post
69,057
Canada Post
45,270
Correos
41,459
DHL
30,799
PostNord
17,073

Top-level Domain Distribution

.com is the most popular top-level domain for ecommerce stores. This is not surprising since alternate top-level domains have only recently been introduced and there is still a certain cachet associated with .com domains.

Top-level Domain
Stores
.com
7,016,358
.de
353,680
.com.br
340,093
.co.uk
294,233
.shop
233,145
.org
220,023
.nl
201,714
.net
197,207
.ru
184,381
.com.au
183,703

Get more insights on stores

Our search interface is easy to use and helps you find the stores that are relevant to you.

You can segment stores on a variety of dimensions:

  • Social Media accounts
  • Email address
  • Phone numbers
  • Country
  • Installed Apps
  • Creation date
  • Platform
  • Top-level domains
  • Domain status
  • Domain type
Filter stores on social media presence
Filter on stores with Facebook accounts.

For more insights on stores, create a free account and have a look for yourself.