Food & Drink stores on T-Soft
There are 97 live T-Soft stores in the Food & Drink category.
In this report, we'll cover the following essential statistics on T-Soft stores in the Food & Drink category.
- Social media usage on T-Soft stores in the Food & Drink category
- Contact information on T-Soft stores in the Food & Drink category
- Top countries for T-Soft stores in the Food & Drink category
- Number of products sold for T-Soft stores in the Food & Drink category
- Top technologies for T-Soft stores in the Food & Drink category
- Top-level domain distribution for T-Soft stores in the Food & Drink category
- Top Food & Drink stores on T-Soft
- New Food & Drink stores on T-Soft
The most popular subcategories under Food & Drink are:
- 70.1% of T-Soft stores in the Food & Drink category sell Food products
- 14.4% of T-Soft stores in the Food & Drink category sell Beverages products
Here are the the top Food & Drink subcategories by store count.
Social Media Usage On T-Soft Stores In The Food & Drink Category
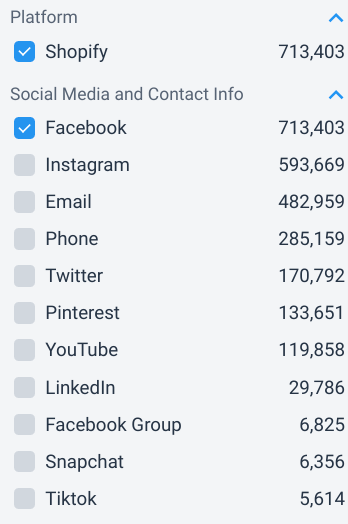
Here are the top social media sites for T-Soft stores in the Food & Drink category.
- Instagram is used by 79.4% of T-Soft stores in the Food & Drink category.
- Facebook is used by 56.7% of T-Soft stores in the Food & Drink category.
- YouTube is used by 42.3% of T-Soft stores in the Food & Drink category.
Contact Information On T-Soft Stores In The Food & Drink Category
Here are the top contact methods for T-Soft stores in the Food & Drink category.
- 79.4% of T-Soft stores in the Food & Drink category provide a phone number on their website
- 47.4% of T-Soft stores in the Food & Drink category have an email on their website
Top Countries For T-Soft Stores In The Food & Drink Category
Here are the top countries for T-Soft stores in the Food & Drink category.
- 82.5% of T-Soft stores in the Food & Drink category are in Turkey
- 7.2% of T-Soft stores in the Food & Drink category are in United States
- 1.0% of T-Soft stores in the Food & Drink category are in United Arab Emirates
With a paid account, stores can also be segmented by region and city.
Top Technologies on T-Soft Stores In The Food & Drink Category
We're tracking 34 different technologies that have 717 collective installs on T-Soft stores in the Food & Drink category.
- Google Tag Manager is used by 80.4% of T-Soft stores in the Food & Drink category.
- YouTube Player is used by 75.3% of T-Soft stores in the Food & Drink category.
- Vimeo is used by 72.2% of T-Soft stores in the Food & Drink category.
Here are the top 10 third-party technologies, ordered by number of installs, across all T-Soft stores.
Number Of Products Sold For T-Soft Stores In The Food & Drink Category
Here is the breakdown of T-Soft stores in the Food & Drink category by the number of products that they sell.
- 19.6% of T-Soft stores in the Food & Drink category sell 25 - 49 different products.
- 16.5% of T-Soft stores in the Food & Drink category sell 10 - 24 different products.
- 13.4% of T-Soft stores in the Food & Drink category sell 250 - 999 different products.
Top-level Domain Distribution For T-Soft Stores In The Food & Drink Category
The majority of T-Soft stores use a .com domain. This is not surprising since alternate top-level domains have only been introduced somewhat recently and there is still a certain cachet associated with .com domains.
- 54.6% of T-Soft stores in the Food & Drink category have a .com domain.
- 42.3% of T-Soft stores in the Food & Drink category have a .com.tr domain.
- 1.0% of T-Soft stores in the Food & Drink category have a .biz domain.
Top Stores In The Food & Drink Category
Here are the top 0 Food & Drink stores ordered by worldwide store rank.
For more insights on T-Soft stores, create a free account and explore our data.
New Stores In The Food & Drink Category
Here are the top 0 most recent Food & Drink stores.
Get more insights on T-Soft stores
Our search interface is easy to use and helps you find the T-Soft stores that are relevant to you.
You can segment stores on a variety of dimensions:
- Social Media accounts
- Email address
- Phone numbers
- Country
- Third-party technologies
- Creation date
- Platform
- Top-level domains
- Domain status
- Domain type
For more insights on T-Soft stores, create a free account and have a look for yourself.
Other Reports
Have a look at these other reports to get a taste for what you can do with Store Leads.