 Store Leads
Packaging stores on neto
There are 9 live neto stores in the Packaging category.
In this report, we'll cover the following essential statistics on neto stores in the Packaging category.
- Social media usage on neto stores in the Packaging category
- Contact information on neto stores in the Packaging category
- Top countries for neto stores in the Packaging category
- Number of products sold for neto stores in the Packaging category
- Top technologies for neto stores in the Packaging category
- Top-level domain distribution for neto stores in the Packaging category
- Top Packaging stores on neto
Social Media Usage On neto Stores In The Packaging Category
Here are the top social media sites for neto stores in the Packaging category.
- Facebook is used by 33.3% of neto stores in the Packaging category.
- Instagram is used by 22.2% of neto stores in the Packaging category.
Contact Information On neto Stores In The Packaging Category
Here are the top contact methods for neto stores in the Packaging category.
- 88.9% of neto stores in the Packaging category have an email on their website
- 88.9% of neto stores in the Packaging category provide a phone number on their website
Top Countries For neto Stores In The Packaging Category
Here are the top countries for neto stores in the Packaging category.
- 22.2% of neto stores in the Packaging category are in Australia
- 11.1% of neto stores in the Packaging category are in Spain
With a paid account, stores can also be segmented by region and city.
Top Technologies on neto Stores In The Packaging Category
We're tracking 12 different technologies that have 24 collective installs on neto stores in the Packaging category.
- Cookie Consent is used by 77.8% of neto stores in the Packaging category.
- Cloudflare is used by 22.2% of neto stores in the Packaging category.
- Google Adsense is used by 22.2% of neto stores in the Packaging category.
Here are the top 10 third-party technologies, ordered by number of installs, across all neto stores.
Number Of Products Sold For neto Stores In The Packaging Category
Here is the breakdown of neto stores in the Packaging category by the number of products that they sell.
- 33.3% of neto stores in the Packaging category sell 100 - 249 different products.
- 11.1% of neto stores in the Packaging category sell 1 - 9 different products.
- 11.1% of neto stores in the Packaging category sell 1000 - 4999 different products.
Top-level Domain Distribution For neto Stores In The Packaging Category
The majority of neto stores use a .com domain. This is not surprising since alternate top-level domains have only been introduced somewhat recently and there is still a certain cachet associated with .com domains.
- 55.6% of neto stores in the Packaging category have a .com domain.
- 11.1% of neto stores in the Packaging category have a .cat domain.
- 11.1% of neto stores in the Packaging category have a .es domain.
Top Stores In The Packaging Category
Here are the top 0 Packaging stores ordered by worldwide store rank.
For more insights on neto stores, create a free account and explore our data.
Get more insights on neto stores
Our search interface is easy to use and helps you find the neto stores that are relevant to you.
You can segment stores on a variety of dimensions:
- Social Media accounts
- Email address
- Phone numbers
- Country
- Third-party technologies
- Creation date
- Platform
- Top-level domains
- Domain status
- Domain type
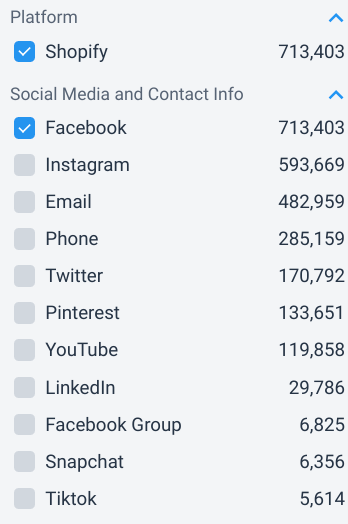
For more insights on neto stores, create a free account and have a look for yourself.
Other Reports
Have a look at these other reports to get a taste for what you can do with Store Leads.